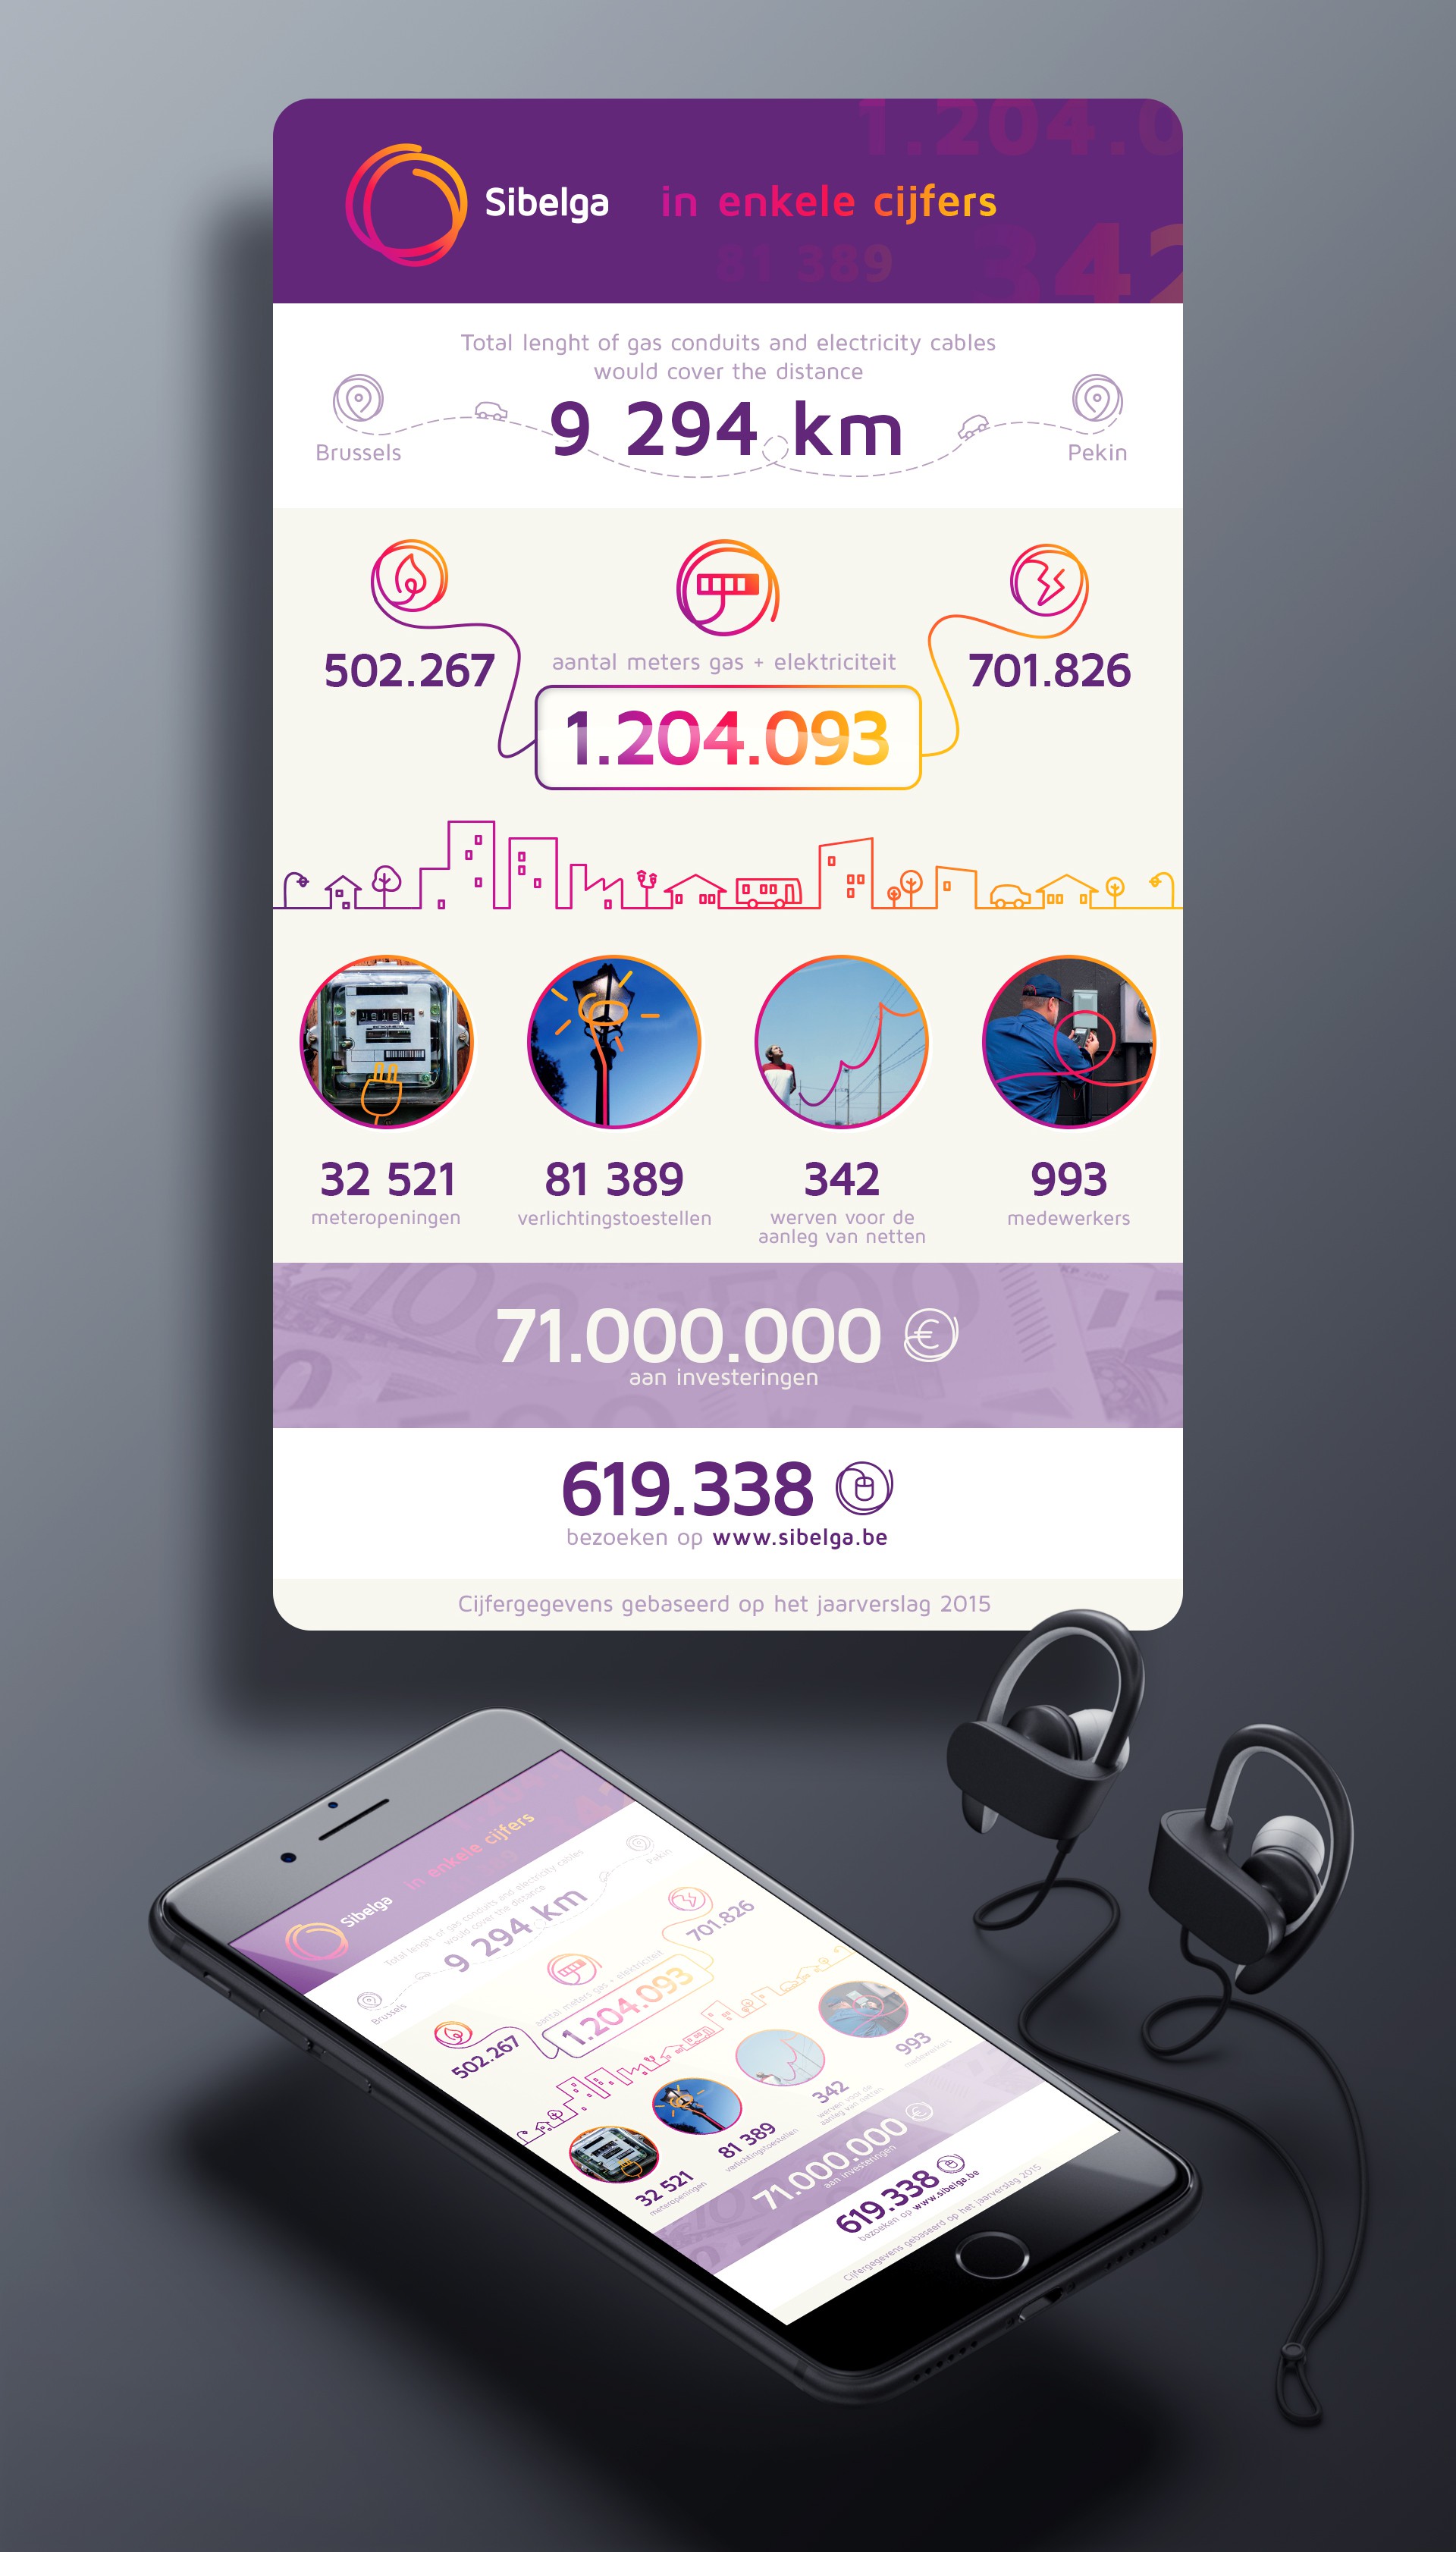
Infographic key figures of the company based on annual report

1
Created on 99designs by Vista
Based on some key figures from client annual report, I would like to create an infographic for the web. It gives an overview of core activities in a general matter, based on the figures of 2015. The infographic has to be made in Dutch and French. The infographic is somewhat playful, without being too busy. It also visible on mobile devices.